Edit chart
Loading graph
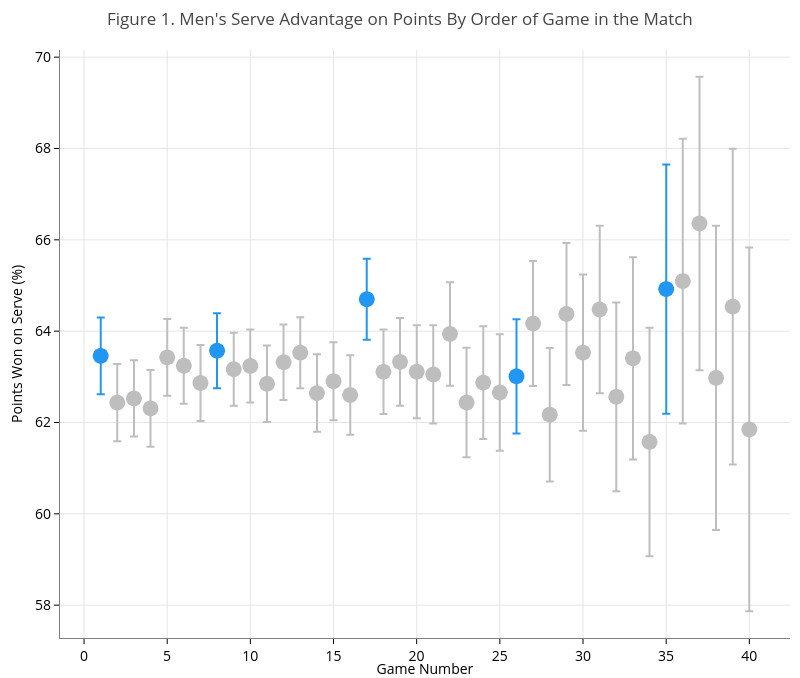
On-the-t's interactive graph and data of "Figure 1. Men's Serve Advantage on Points By Order of Game in the Match" is a scatter chart, showing FALSE vs TRUE; with Game Number in the x-axis and Points Won on Serve (%) in the y-axis.. The x-axis shows values from -1.4450000000000003 to 42.445. The y-axis shows values from 57.2806405064141 to 70.1566358919553.