Edit chart
Loading graph
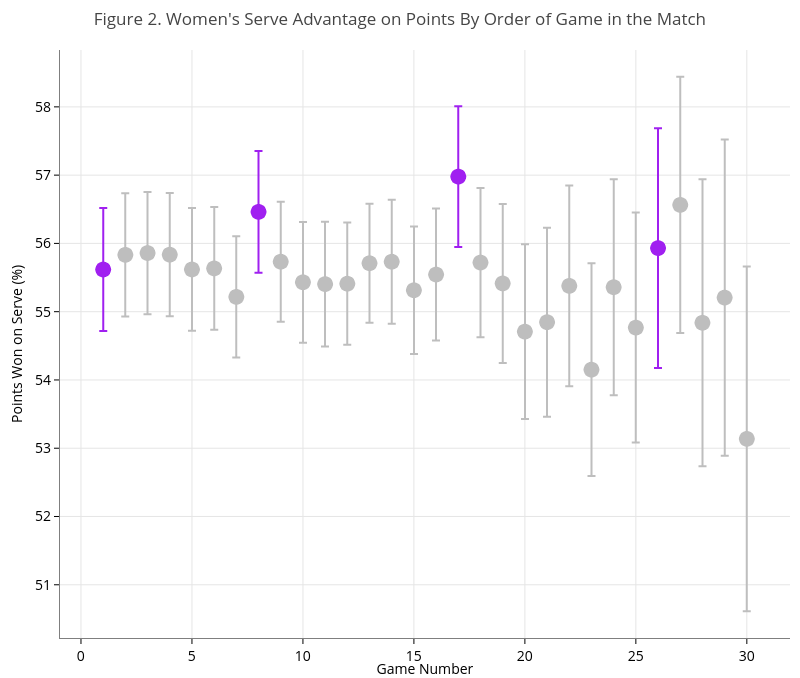
On-the-t's interactive graph and data of "Figure 2. Women's Serve Advantage on Points By Order of Game in the Match" is a scatter chart, showing FALSE vs TRUE; with Game Number in the x-axis and Points Won on Serve (%) in the y-axis.. The x-axis shows values from -0.9450000000000003 to 31.945. The y-axis shows values from 50.2202827286982 to 58.8328188374209.