Edit chart
Loading graph
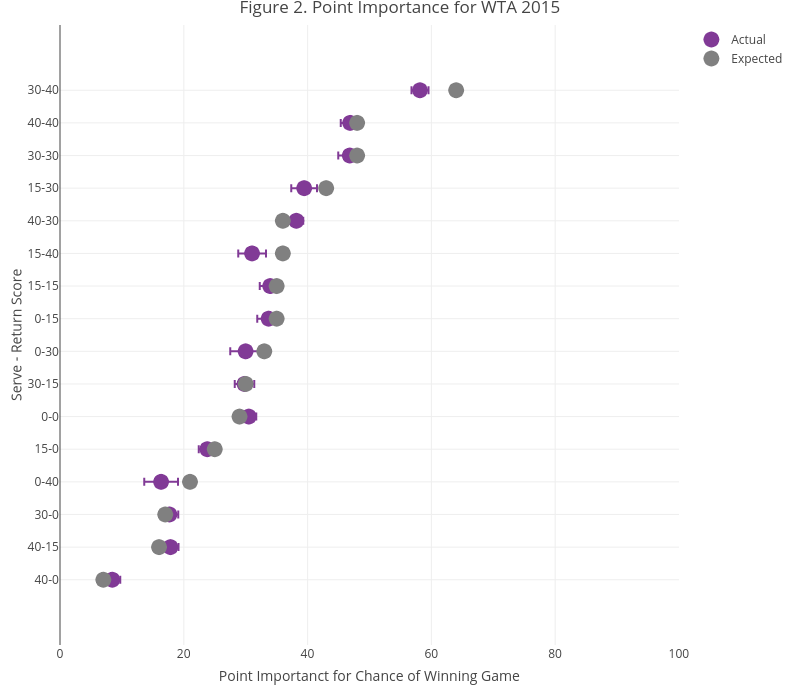
On-the-t's interactive graph and data of "Figure 2. Point Importance for WTA 2015" is a scatter chart, showing Actual vs Expected; with Point Importanct for Chance of Winning Game in the x-axis and Serve - Return Score in the y-axis.. The x-axis shows values from 0 to 100. The y-axis shows values from -2 to 17.