Edit chart
Loading graph
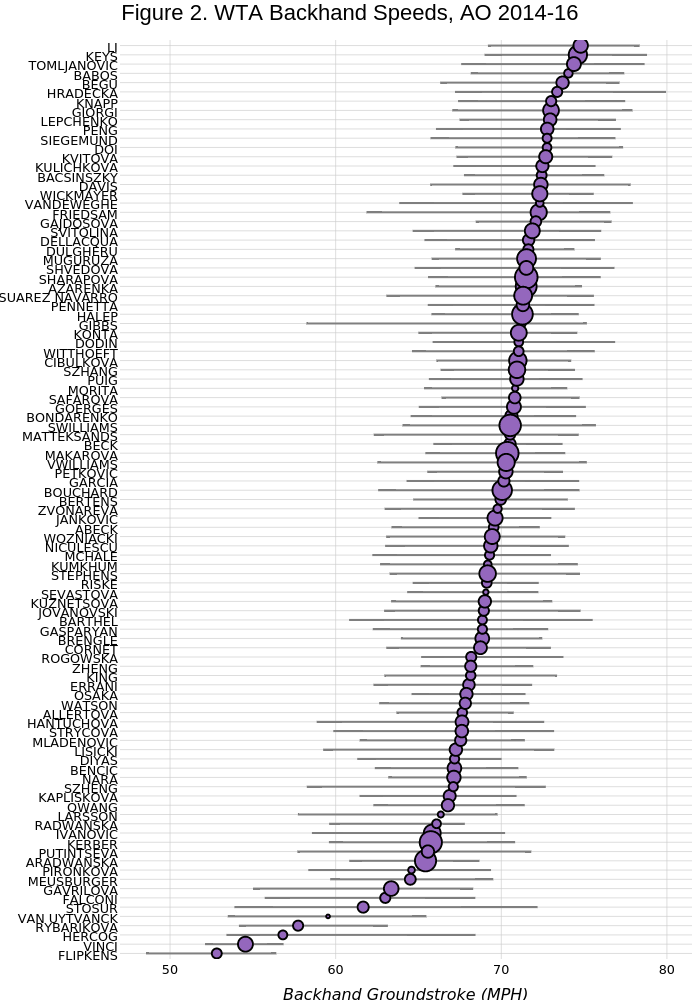
On-the-t's interactive graph and data of "Figure 2. WTA Backhand Speeds, AO 2014-16" is a line chart, showing vs . The x-axis shows values from 46.979338482323 to 81.5147775732547. The y-axis shows values from 0.4 to 99.6. This visualization has the following annotation: Backhand Groundstroke (MPH)