Edit chart
Loading graph
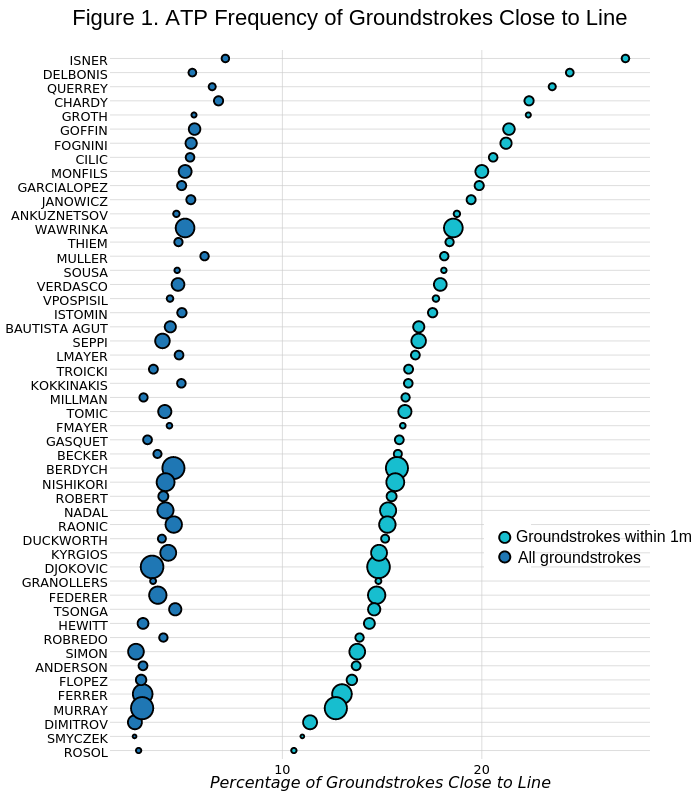
On-the-t's interactive graph and data of "Figure 1. ATP Frequency of Groundstrokes Close to Line" is a scatter chart, showing vs . The x-axis shows values from 1.35764705882353 to 28.4305882352941. The y-axis shows values from 0.4 to 50.6. This visualization has the following annotations: Percentage of Groundstrokes Close to Line ; Groundstrokes within 1m; All groundstrokes