Edit chart
Loading graph
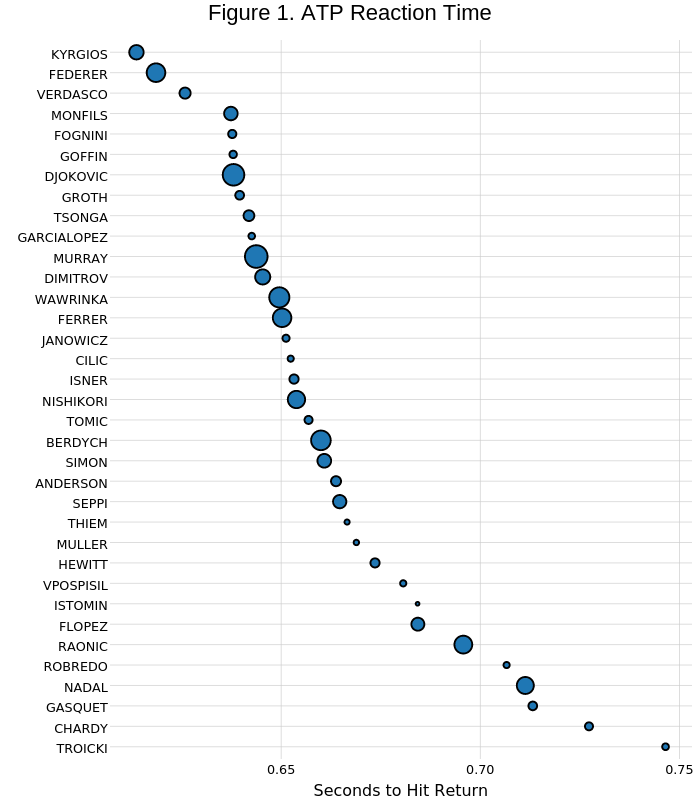
On-the-t's interactive graph and data of "Figure 1. ATP Reaction Time" is a scatter chart; with Seconds to Hit Return in the x-axis. The x-axis shows values from 0.607011637181144 to 0.753143064463996. The y-axis shows values from 0.4 to 35.6.