Edit chart
Loading graph
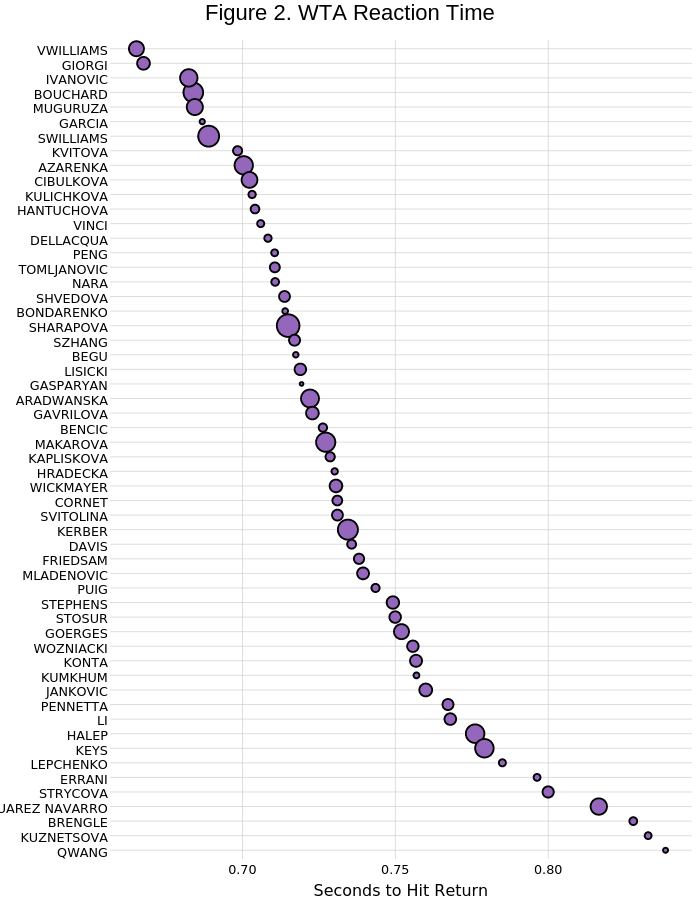
On-the-t's interactive graph and data of "Figure 2. WTA Reaction Time" is a scatter chart; with Seconds to Hit Return in the x-axis. The x-axis shows values from 0.656682276693181 to 0.846976666731238. The y-axis shows values from 0.4 to 56.6.