Edit chart
Loading graph
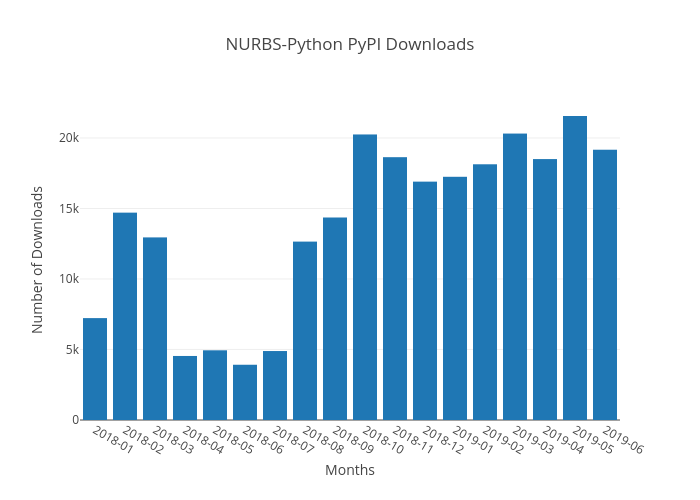
Orbingol's interactive graph and data of "NURBS-Python PyPI Downloads" is a bar chart; with Months in the x-axis and Number of Downloads in the y-axis.. The x-axis shows values from 0 to 0. The y-axis shows values from 0 to 0.