Edit chart
Loading graph
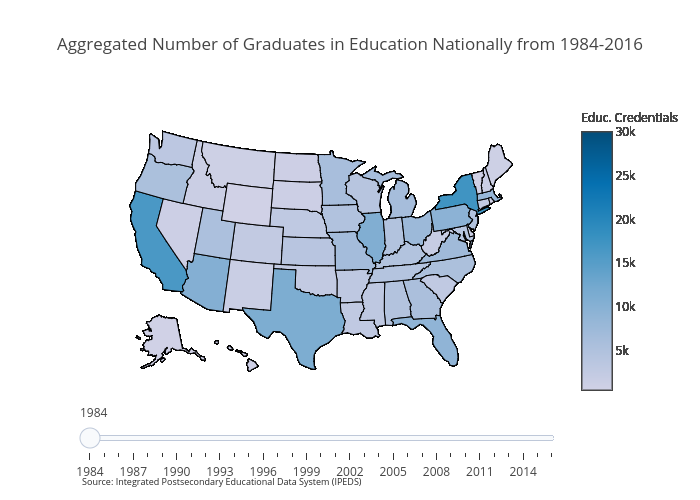
Otteheng's interactive graph and data of "Aggregated Number of Graduates in Education Nationally from 1984-2016" is a choropleth. The x-axis shows values from 0 to 0. The y-axis shows values from 0 to 0. This visualization has the following annotation: Source: Integrated Postsecondary Educational Data System (IPEDS)