Edit chart
Loading graph
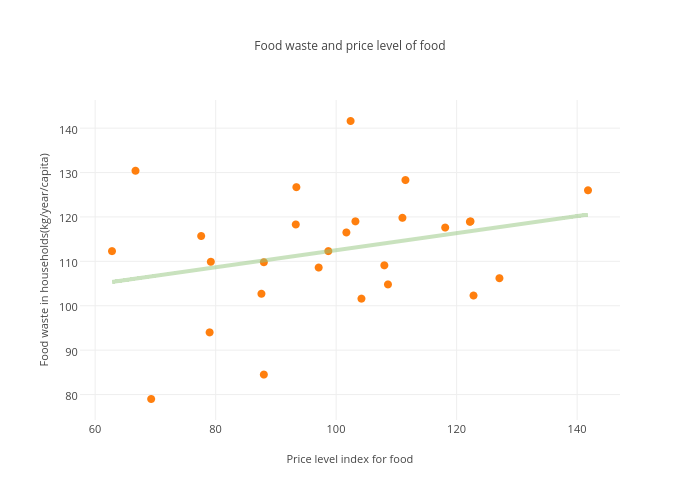
Parikovape's interactive graph and data of "Food waste and price level of food" is a scatter chart, showing Col3 vs Col3 - fit; with Price level index for food in the x-axis and Food waste in households(kg/year/capita) in the y-axis.. The x-axis shows values from 57.876337273059576 to 146.72366272694043. The y-axis shows values from 74.40180412371134 to 146.19819587628865.