Edit chart
Loading graph
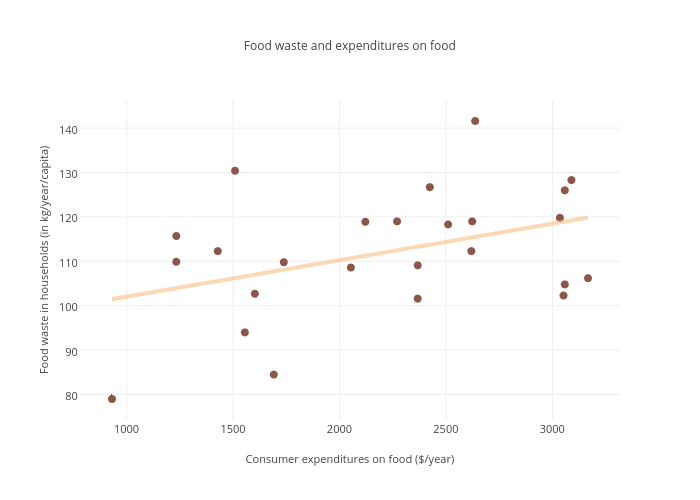
Parikovape's interactive graph and data of "Food waste and expenditures on food" is a scatter chart, showing Col3 vs Col3 - fit; with Consumer expenditures on food ($/year) in the x-axis and Food waste in households (in kg/year/capita) in the y-axis.. The x-axis shows values from 791.6416473741928 to 3306.358352625807. The y-axis shows values from 74.40180412371134 to 146.19819587628865.