Edit chart
Loading graph
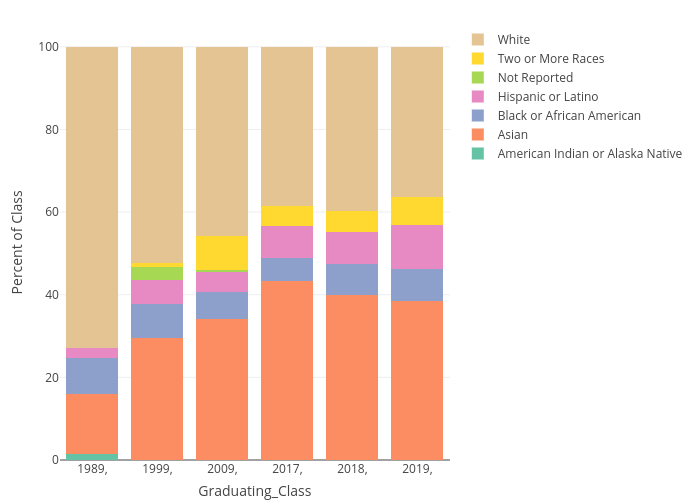
Parthd4's interactive graph and data of "Percent of Class vs Graduating_Class" is a stacked bar chart, showing American Indian or Alaska Native, Asian, Black or African American, Hispanic or Latino, Not Reported, Two or More Races, White; with Graduating_Class in the x-axis and Percent of Class in the y-axis.. The x-axis shows values from 0 to 0. The y-axis shows values from 0 to 0.