Edit chart
Loading graph
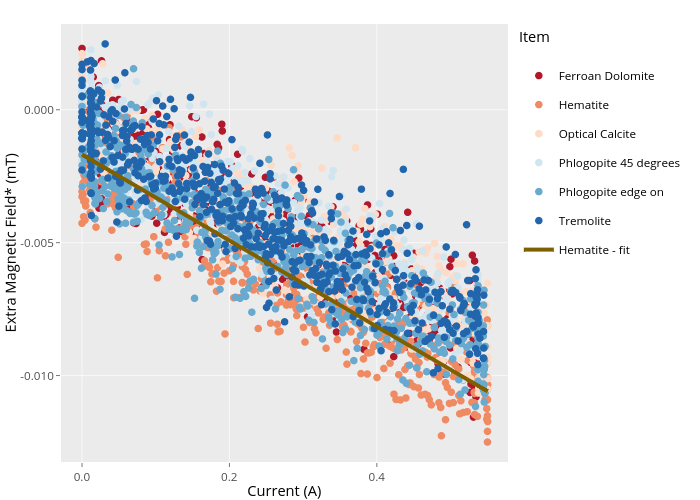
Paselkin's interactive graph and data of "Extra Magnetic Field* (mT) vs Current (A)" is a scatter chart, showing Ferroan Dolomite, Hematite, Optical Calcite, Phlogopite 45 degrees, Phlogopite edge on, Tremolite, Hematite - fit; with Current (A) in the x-axis and Extra Magnetic Field* (mT) in the y-axis.. The x-axis shows values from -0.02852058375 to 0.57795143075. The y-axis shows values from -0.0132525809804552 to 0.00322679872091436. This visualization has the following annotation: Item