Edit chart
Loading graph
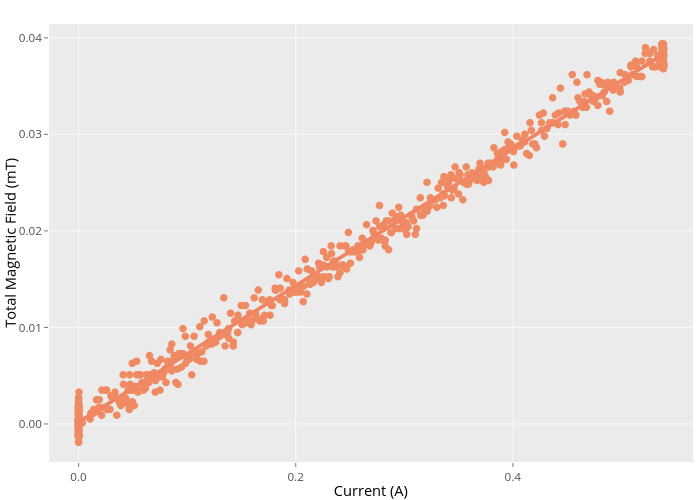
Paselkin's interactive graph and data of "Total Magnetic Field (mT) vs Current (A)" is a scatter chart, showing , fitted values, ; with Current (A) in the x-axis and Total Magnetic Field (mT) in the y-axis.. The x-axis shows values from -0.02726554895 to 0.56586265595. The y-axis shows values from -0.0039422609 to 0.0414300529. This visualization has the following annotation: Item