Edit chart
Loading graph
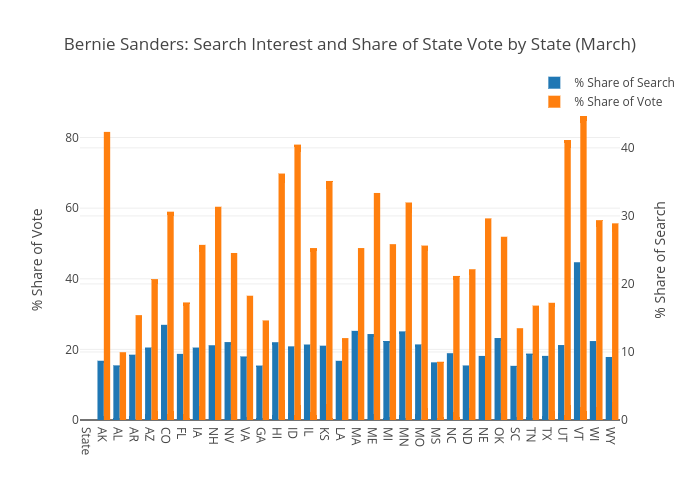
Pat.h's interactive graph and data of "Bernie Sanders: Search Interest and Share of State Vote by State (March)" is a bar chart, showing % Share of Search vs % Share of Vote; with % Share of Vote in the y-axis. The x-axis shows values from 0.5 to 33.5. The y-axis shows values from 0 to 90.63157894736841.