Edit chart
Loading graph
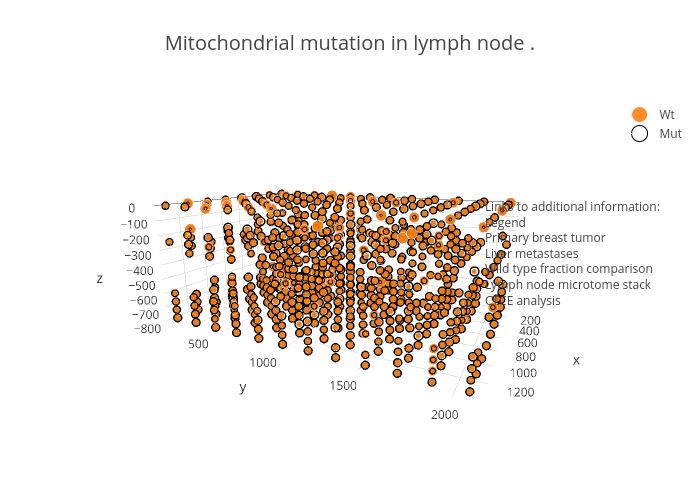
Peroe's interactive graph and data of "Mitochondrial mutation in lymph node ." is a scatter3d, showing Wt vs Mut. The x-axis shows values from -0.07427956989247313 to 1.2693763440860217. The y-axis shows values from -0.30000000000000004 to 1.7. This visualization has the following annotation: Links to additional information:LegendPrimary breast tumorLiver metastasesWild type fraction comparisonLymph node microtome stackCTCE analysis