Edit chart
Loading graph
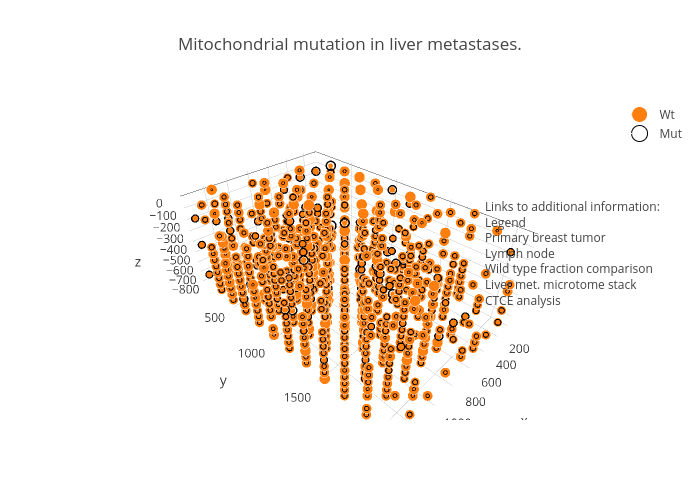
Peroe's interactive graph and data of "Mitochondrial mutation in liver metastases." is a scatter3d, showing Wt vs Mut. The x-axis shows values from 0 to 0. The y-axis shows values from 0 to 0. This visualization has the following annotation: Links to additional information:LegendPrimary breast tumorLymph nodeWild type fraction comparisonLiver met. microtome stackCTCE analysis