0%
5%
10%
15%
20%
25%
30%
35%
40%
45%
50%
55%
60%
65%
70%
75%
80%
85%
90%
95%
100%
100 %
95 %
90 %
85 %
80 %
75 %
70 %
65 %
60 %
55 %
50 %
45 %
40 %
35 %
30 %
25 %
20 %
15 %
10 %
5 %
0 %
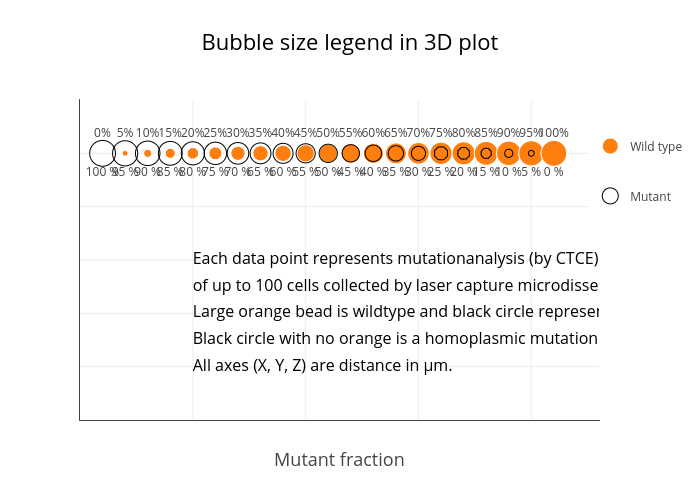
Each data point represents mutationanalysis (by CTCE)
of up to 100 cells collected by laser capture microdissection.
Large orange bead is wildtype and black circle represent mutant fraction.
Black circle with no orange is a homoplasmic mutation.
All axes (X, Y, Z) are distance in μm.
Wild type
Mutant
Bubble size legend in 3D plot
Mutant fraction
plotly-logomark
Edit chart
Peroe's interactive graph and data of "Bubble size legend in 3D plot" is a scatter chart, showing Wild type, Mutant, Col10, Col12, Col15; with Mutant fraction in the x-axis. The x-axis shows values from 0 to 23. The y-axis shows values from 0 to 1.2.