Internal standard
Sample
Internal standard
Sample
Internal standard
Sample
Internal standard
Sample
Internal standard
Sample
100% 0%
90% 10%
70% 30%
30% 70%
0% 100%
Wild type Mutant
34
36
38
40
42
44
46
Exampl of
cycling temperature capillary electrophoresis analysis
translated into bead size values in 3D plots.
Elution time, minutes
Relative fluorescence
plotly-logomark
Edit chart
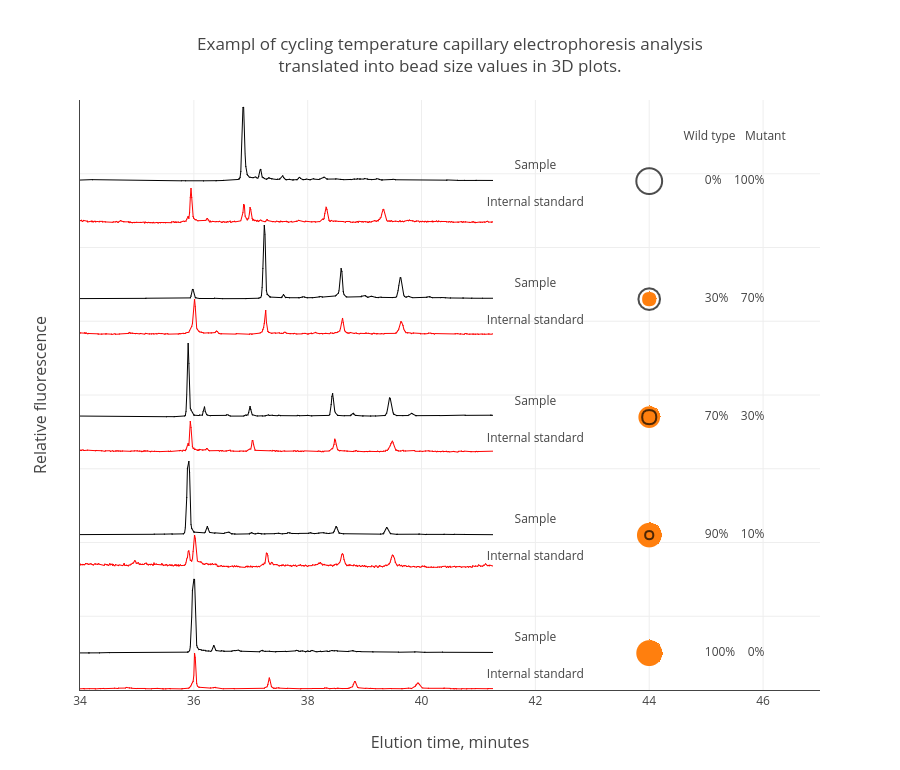
Peroe's interactive graph and data of "Exampl of cycling temperature capillary electrophoresis analysistranslated into bead size values in 3D plots." is a scatter chart, showing Col2, Col5, Col9, Col12, Col2, Col4, Col6, Col8, Col10, Col12, Col14, Col16, Col18, Col20; with Elution time, minutes in the x-axis and Relative fluorescence in the y-axis.. The x-axis shows values from 34 to 47. The y-axis shows values from 0 to 8.