Edit chart
Loading graph
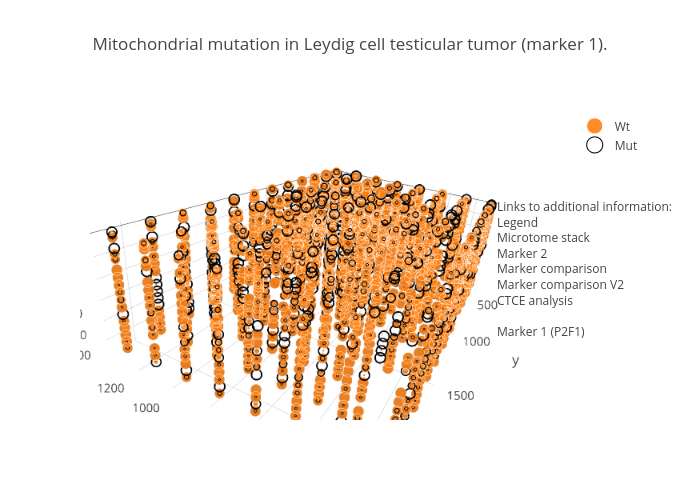
Peroe's interactive graph and data of "Mitochondrial mutation in Leydig cell testicular tumor (marker 1)." is a scatter3d, showing Wt vs Mut. The x-axis shows values from 0 to 0. The y-axis shows values from 0 to 0. This visualization has the following annotation: Links to additional information:LegendMicrotome stackMarker 2Marker comparisonMarker comparison V2CTCE analysisMarker 1 (P2F1)