Edit chart
Loading graph
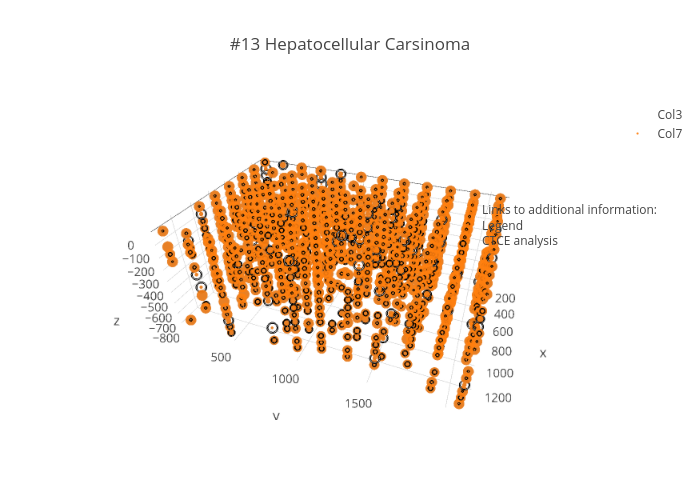
Peroe's interactive graph and data of "#13 Hepatocellular Carsinoma" is a scatter3d, showing Col3 vs Col7. The x-axis shows values from 0 to 0. The y-axis shows values from 0 to 0. This visualization has the following annotation: Links to additional information:LegendCTCE analysis