Edit chart
Loading graph
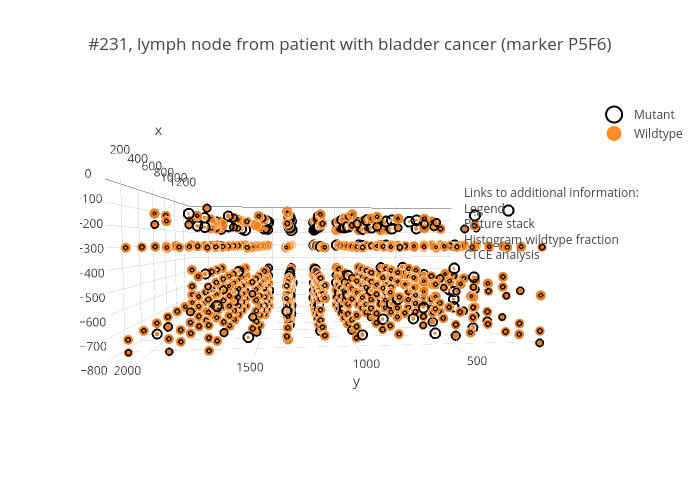
Peroe's interactive graph and data of "#231, lymph node from patient with bladder cancer (marker P5F6)" is a scatter3d, showing Mutant vs Wildtype. The x-axis shows values from 0.07070856516040713 to 2.070708565160407. The y-axis shows values from -0.03164556962025322 to 1.9683544303797467. This visualization has the following annotation: Links to additional information:LegendPicture stackHistogram wildtype fractionCTCE analysis