Edit chart
Loading graph
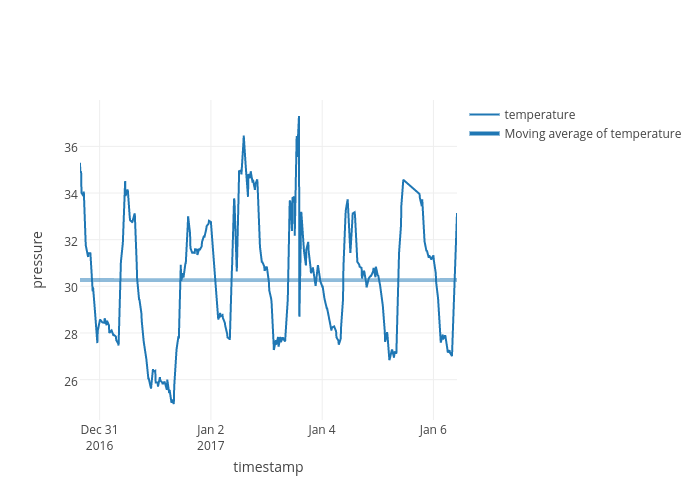
Peterverweij's interactive graph and data of "pressure vs timestamp" is a line chart, showing temperature; with timestamp in the x-axis and pressure in the y-axis.. The x-axis shows values from 2016-12-30 15:31:25 to 2017-01-06 10:10:02. The y-axis shows values from 24.26984182993567 to 37.986812909444225.