Edit chart
Loading graph
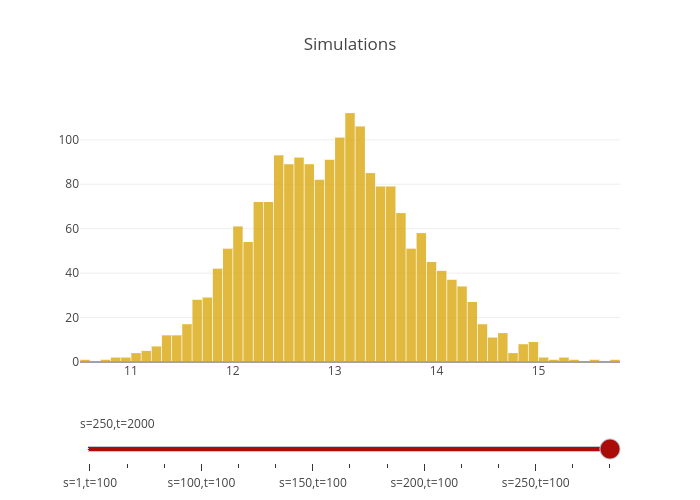
Phanideep_gampa's interactive graph and data of "Simulations" is a histogram, showing s=250t=2000. The x-axis shows values from 10.500000000000002 to 15.799999999999981. The y-axis shows values from 0 to 117.89473684210526.