Edit chart
Loading graph
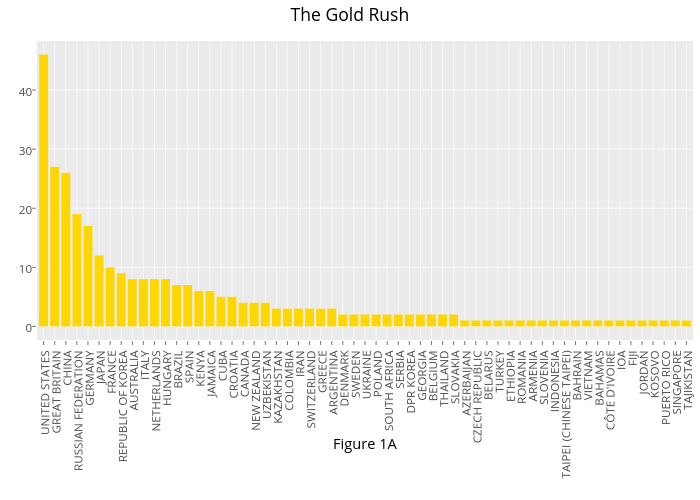
Planetamita's interactive graph and data of "The Gold Rush" is a bar chart; with Figure 1A in the x-axis and in the y-axis.. The x-axis shows values from 0.4 to 59.6. The y-axis shows values from -2.3 to 48.3.