Edit chart
Loading graph
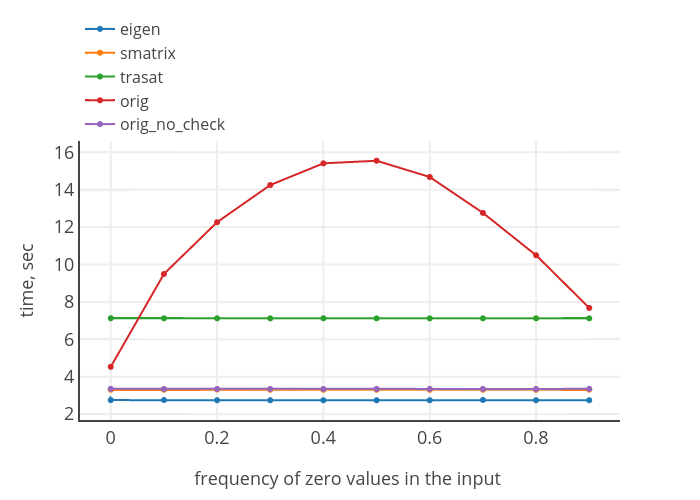
Plexoos's interactive graph and data of "" is a line chart, showing eigen, smatrix, trasat, orig, orig_no_check; with frequency of zero values in the input in the x-axis and time, sec in the y-axis.. The x-axis shows values from -0.0587556488056811 to 0.9587556488056811. The y-axis shows values from 1.9569029468915868 to 16.332741997108414.