Edit chart
Loading graph
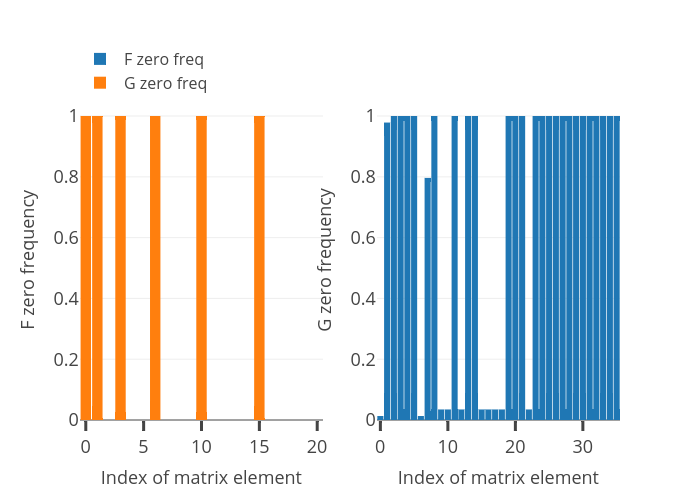
Plexoos's interactive graph and data of "F zero frequency vs Index of matrix element" is a grouped bar chart, showing F zero freq vs G zero freq; with Index of matrix element in the x-axis and F zero frequency in the y-axis.. The x-axis shows values from -0.5 to 20.5. The y-axis shows values from 0 to 1.0526315789473684.