Edit chart
Loading graph
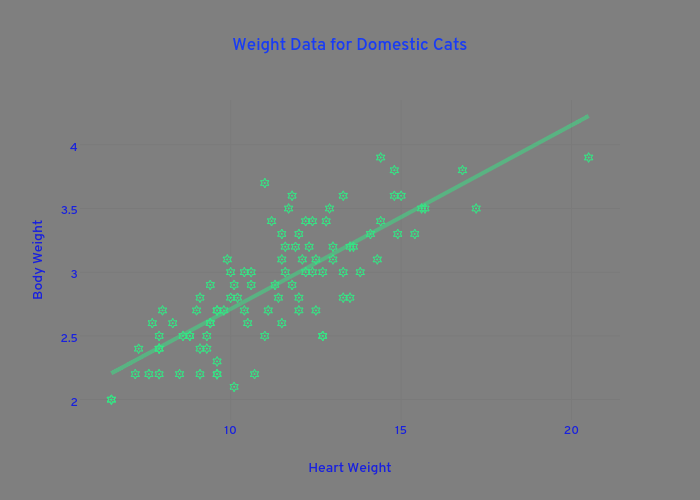
Plotly2_demo's interactive graph and data of "Weight Data for Domestic Cats" is a scatter chart, showing vs Fit of Bwt; with Heart Weight in the x-axis and Body Weight in the y-axis.. The x-axis shows values from 5.646701437052655 to 21.353298562947344. The y-axis shows values from 1.8483012592996007 to 4.35079900378667.