Edit chart
Loading graph
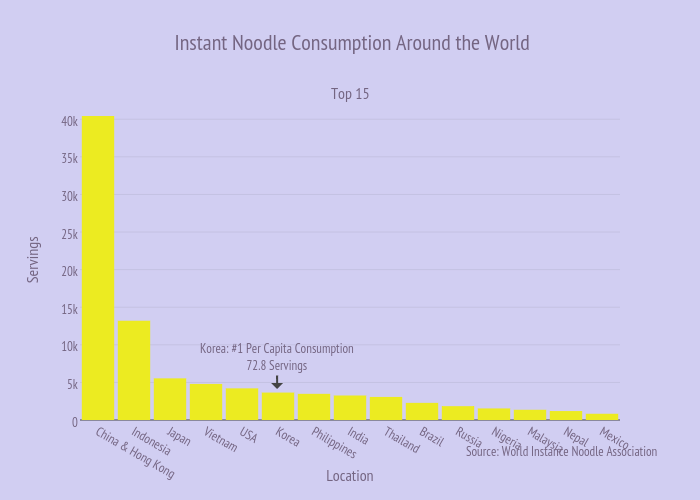
Plotly2_demo's interactive graph and data of " Instant Noodle Consumption Around the World" is a bar chart, showing Servings; with Location in the x-axis and Servings in the y-axis.. The x-axis shows values from -0.5 to 14.5. The y-axis shows values from 0 to 42557.89473684211. This visualization has the following annotations: Top 15; Source: World Instance Noodle Association; Korea: #1 Per Capita Consumption72.8 Servings