Edit chart
Loading graph
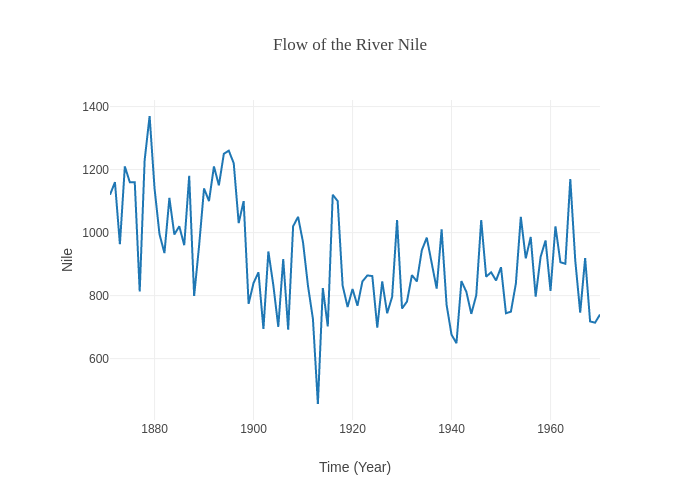
Plotly2_demo's interactive graph and data of "Flow of the River Nile" is a line chart; with Time (Year) in the x-axis and Nile in the y-axis.. The x-axis shows values from 1871 to 1970. The y-axis shows values from 405.22222222222223 to 1420.7777777777778.