Edit chart
Loading graph
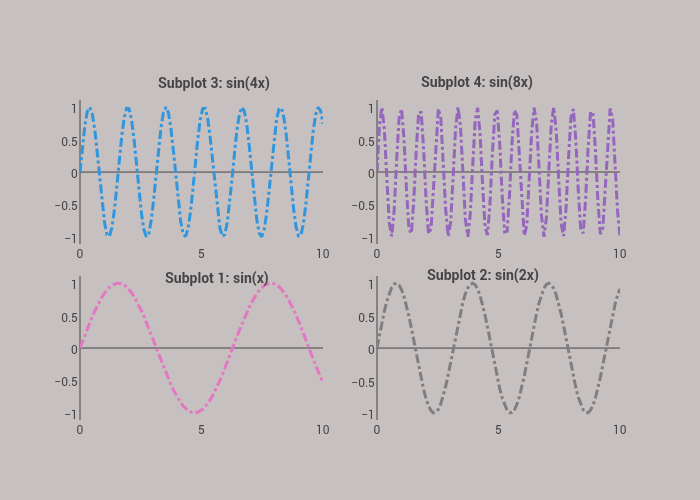
Plotly2_demo's interactive graph and data of "Trace 1, Trace 2, Trace 3, Trace 4" is a line chart, showing Trace 1, Trace 2, Trace 3, Trace 4. The x-axis shows values from 0 to 10. The y-axis shows values from -1.1104443857222224 to 1.1107521687222222. This visualization has the following annotations: Subplot 1: sin(x); Subplot 2: sin(2x); Subplot 3: sin(4x); Subplot 4: sin(8x)