Edit chart
Loading graph
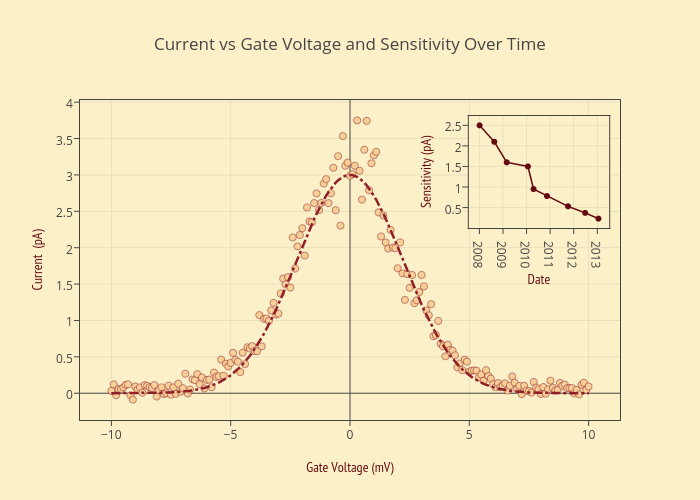
Plotly2_demo's interactive graph and data of "Current vs Gate Voltage and Sensitivity Over Time" is a scatter chart, showing Current 1 (pA), Current 2 (pA), Sensitivity (pA); with Gate Voltage (mV) in the x-axis and Current (pA) in the y-axis.. The x-axis shows values from -11.179642617981884 to 11.179642617981884. The y-axis shows values from -0.3272210547191603 to 3.98903834471916.