Edit chart
Loading graph
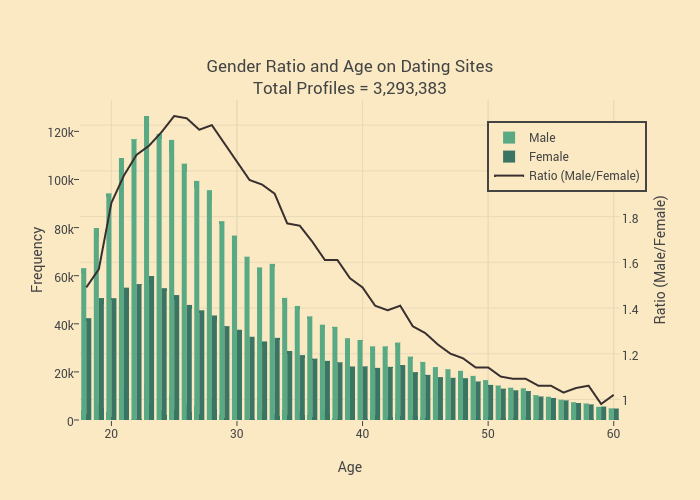
Plotly2_demo's interactive graph and data of "Gender Ratio and Age on Dating SitesTotal Profiles = 3,293,383" is a filled bar chart, showing Male, Female, Ratio (Male/Female); with Age in the x-axis and Frequency in the y-axis.. The x-axis shows values from 17.5 to 60.5. The y-axis shows values from 0 to 133051.57894736843.