Edit chart
Loading graph
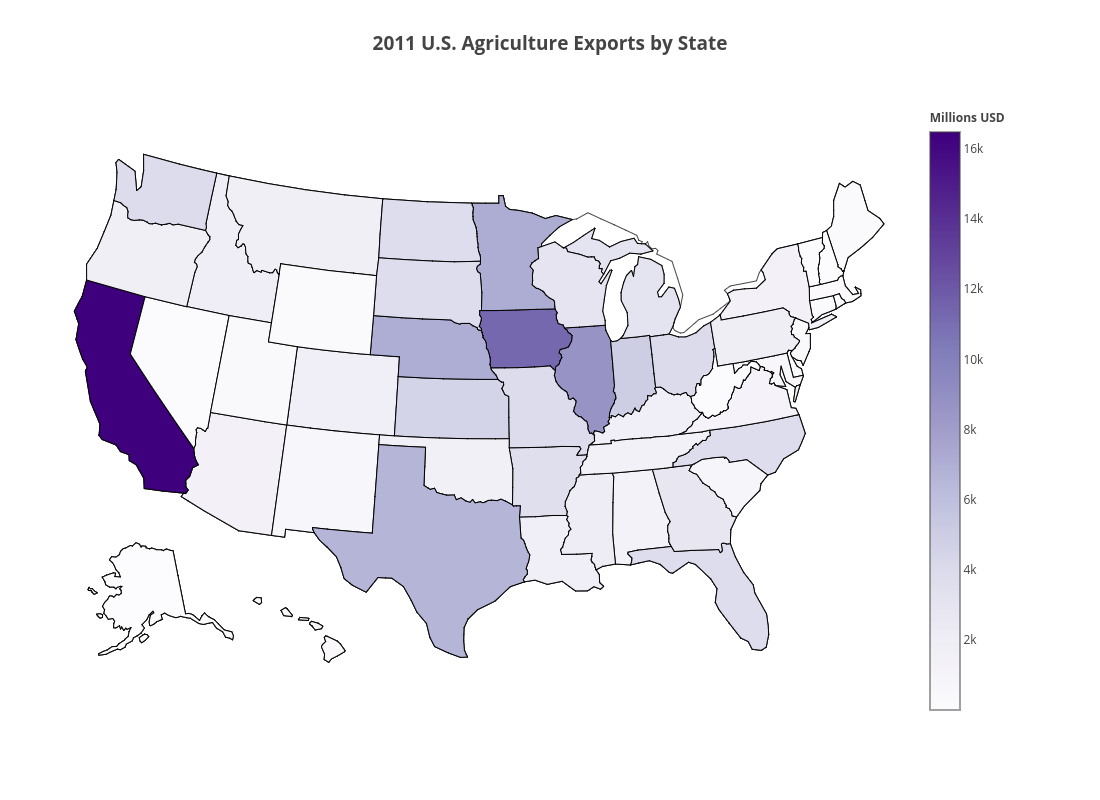
Plotly2_demo's interactive graph and data of "2011 U.S. Agriculture Exports by State" is a choropleth, showing total exports. The x-axis shows values from 0 to 0. The y-axis shows values from 0 to 0.