Edit chart
Loading graph
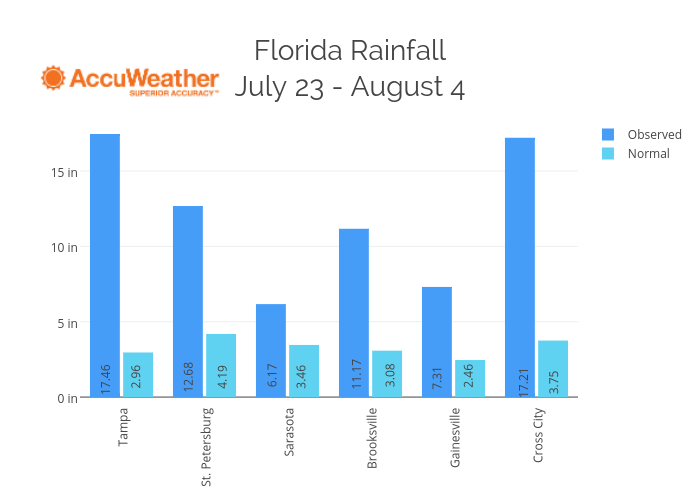
Plotly2_demo's interactive graph and data of "Florida RainfallJuly 23 - August 4" is a grouped bar chart, showing Observed vs Normal. The x-axis shows values from -0.5 to 5.5. The y-axis shows values from -0.025414194343838736 to 18.380284957597045. This visualization has the following annotations: 3.75; 17.21; 2.46; 7.31; 3.08; 11.17; 3.46; 6.17; 4.19; 12.68; 2.96; 17.46