Edit chart
Loading graph
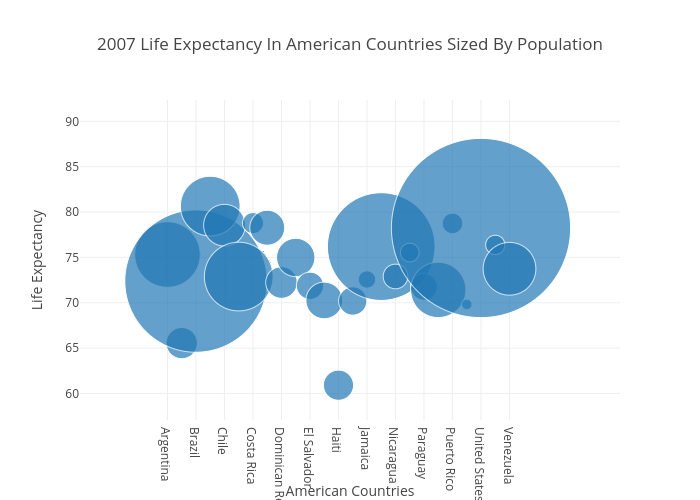
Plotly2_demo's interactive graph and data of "2007 Life Expectancy In American Countries Sized By Population" is a scatter chart; with American Countries in the x-axis and Life Expectancy in the y-axis.. The x-axis shows values from -2.73572719146489 to 26.908697159566703. The y-axis shows values from 58.836494130456074 to 84.31105441201598.