Edit chart
Loading graph
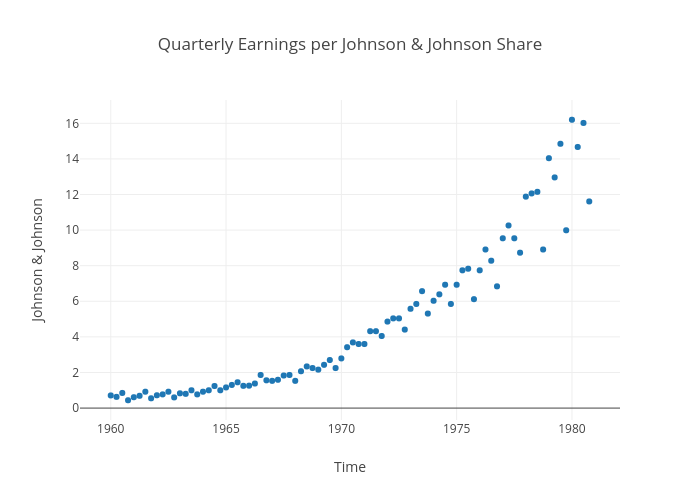
Plotly2_demo's interactive graph and data of "Quarterly Earnings per Johnson & Johnson Share" is a scatter chart, showing JohnsonJohnson; with Time in the x-axis and Johnson & Johnson in the y-axis.. The x-axis shows values from 1958.7069133398247 to 1982.0430866601753. The y-axis shows values from -0.6865749235474006 to 17.3265749235474.