Edit chart
Loading graph
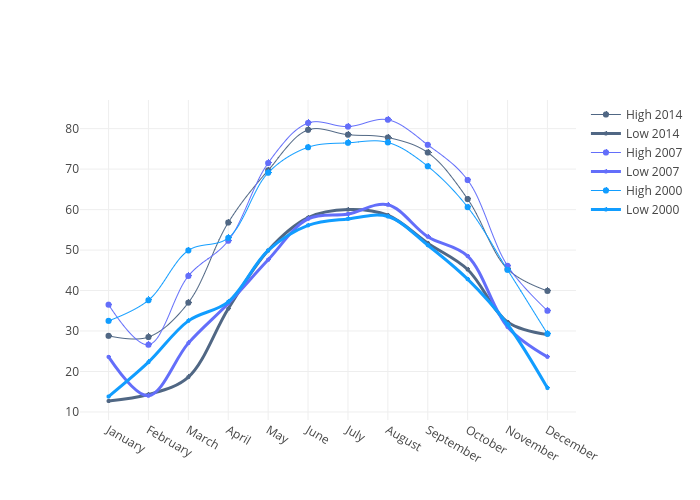
Plotly2_demo's interactive graph and data of "High 2014, Low 2014, High 2007, Low 2007, High 2000, Low 2000" is a , showing High 2014, Low 2014, High 2007, Low 2007, High 2000, Low 2000. The x-axis shows values from -0.6643437862950059 to 11.664343786295007. The y-axis shows values from 8.411984711984712 to 86.58288288288288.