Edit chart
Loading graph
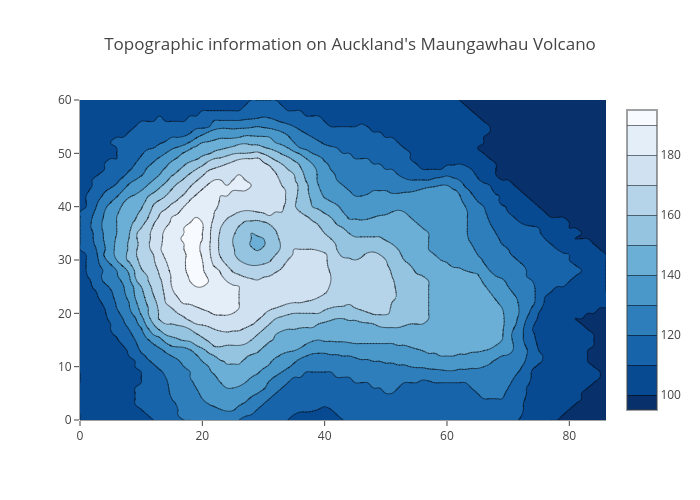
Plotly2_demo's interactive graph and data of "Topographic information on Auckland's Maungawhau Volcano" is a contour. The x-axis shows values from 0 to 86. The y-axis shows values from 0 to 60.