Edit chart
Loading graph
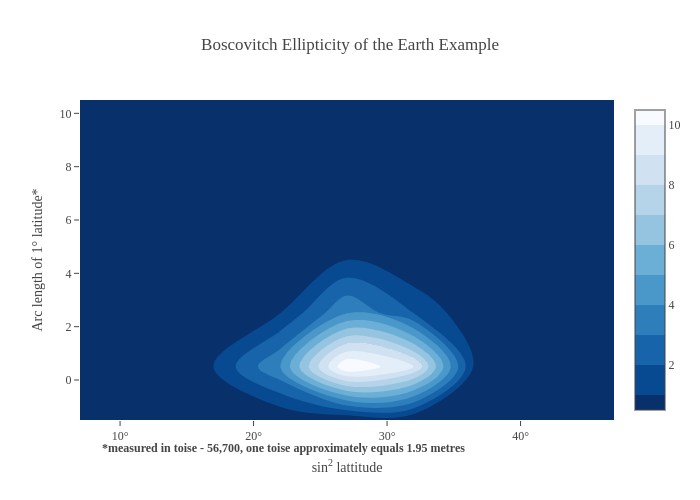
Plotly2_demo's interactive graph and data of "Boscovitch Ellipticity of the Earth Example" is a histogram2dcontour; with sin2 lattitude in the x-axis and Arc length of 1° latitude* in the y-axis.. The x-axis shows values from 7 to 47. The y-axis shows values from -1.5 to 10.5. This visualization has the following annotation: *measured in toise - 56,700, one toise approximately equals 1.95 metres