Edit chart
Loading graph
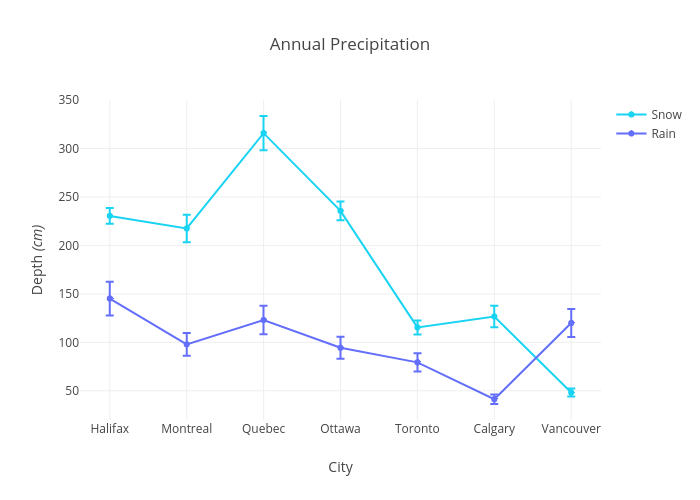
Plotly2_demo's interactive graph and data of "Annual Precipitation" is a with vertical error bars, showing Snow vs Rain; with City in the x-axis and Depth (cm) in the y-axis.. The x-axis shows values from -0.3644162625885864 to 6.364416262588587. The y-axis shows values from 19.829777777777775 to 350.11422222222217.