Edit chart
Loading graph
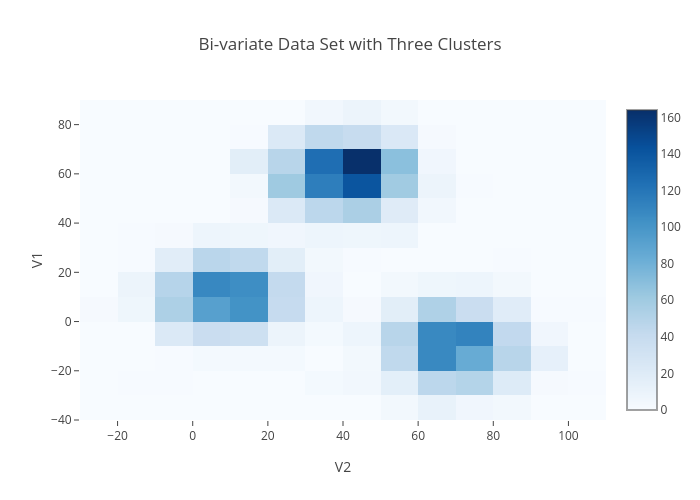
Plotly2_demo's interactive graph and data of "Bi-variate Data Set with Three Clusters" is a 2-dimensional histogram; with V2 in the x-axis and V1 in the y-axis.. The x-axis shows values from -30 to 110. The y-axis shows values from -40 to 90.