Edit chart
Loading graph
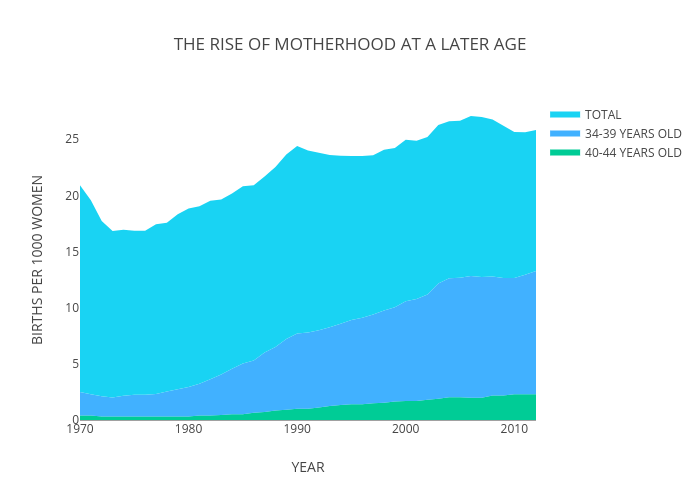
Plotly2_demo's interactive graph and data of "THE RISE OF MOTHERHOOD AT A LATER AGE" is a , showing 40-44 YEARS OLD, 34-39 YEARS OLD, TOTAL; with YEAR in the x-axis and BIRTHS PER 1000 WOMEN in the y-axis.. The x-axis shows values from 1970 to 2012. The y-axis shows values from 0 to 28.484210526315792.