Edit chart
Loading graph
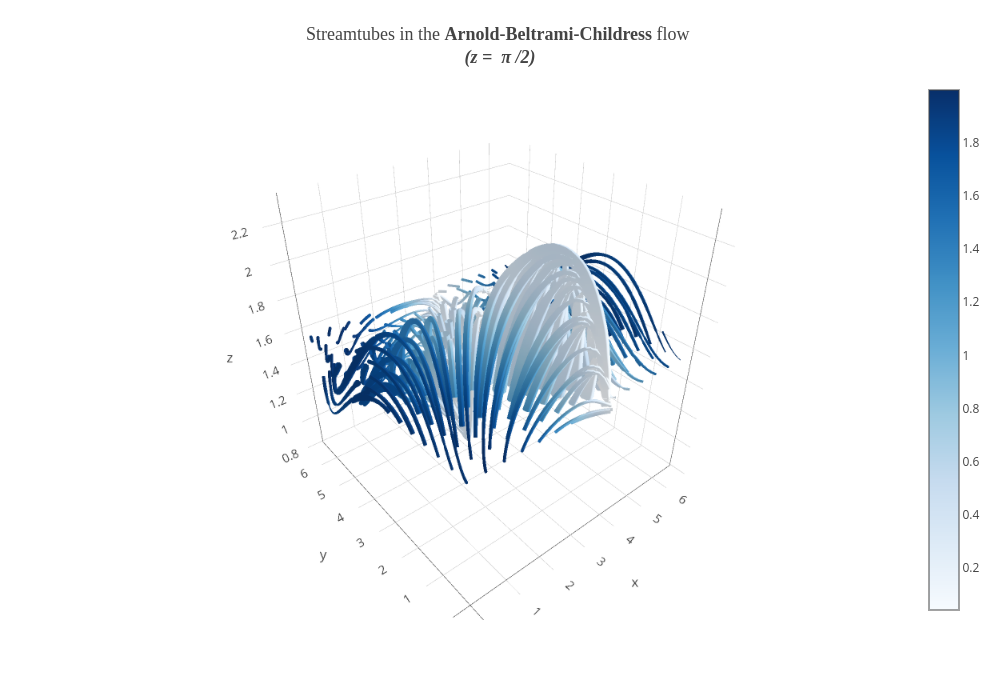
Plotly2_demo's interactive graph and data of "Streamtubes in the Arnold-Beltrami-Childress flow (z = π /2) " is a streamtube. The x-axis shows values from -1 to 6. The y-axis shows values from -1 to 4.