Edit chart
Loading graph
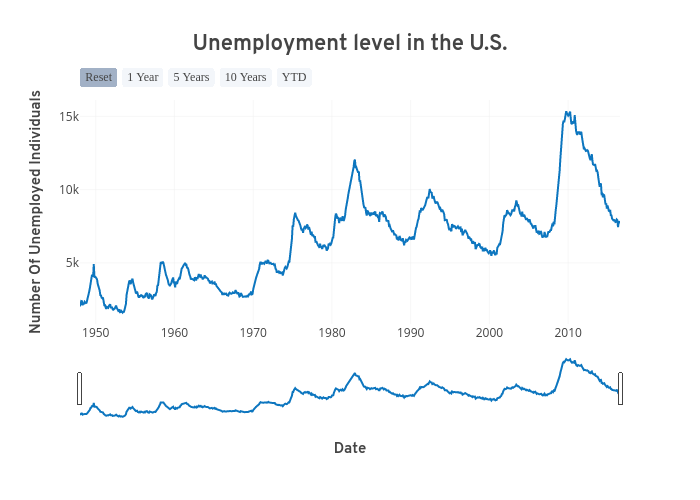
Plotly2_demo's interactive graph and data of "Unemployment level in the U.S." is a line chart; with Date in the x-axis and Number Of Unemployed Individuals in the y-axis.. The x-axis shows values from 1948-01-01 to 2016-08-01. The y-axis shows values from 831.7777777777777 to 16116.222222222223.