Edit chart
Loading graph
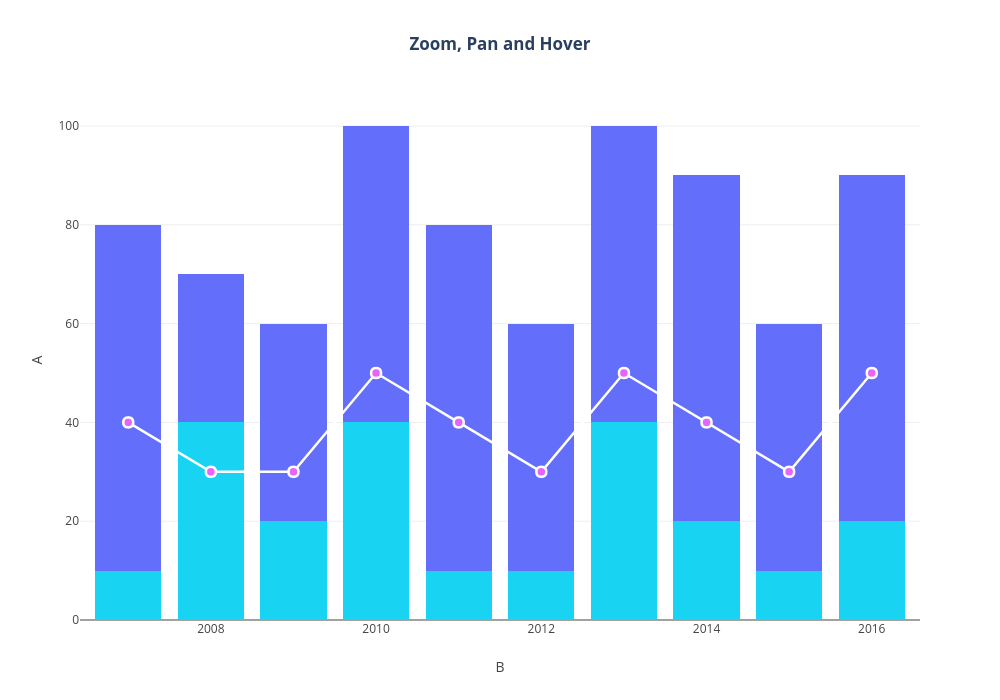
Plotly2_demo's interactive graph and data of "Zoom, Pan and Hover" is a stacked bar chart, showing B, C, D; with B in the x-axis and A in the y-axis.. The x-axis shows values from 2006.415938130464 to 2016.584061869536. The y-axis shows values from 0 to 105.26315789473684.