Edit chart
Loading graph
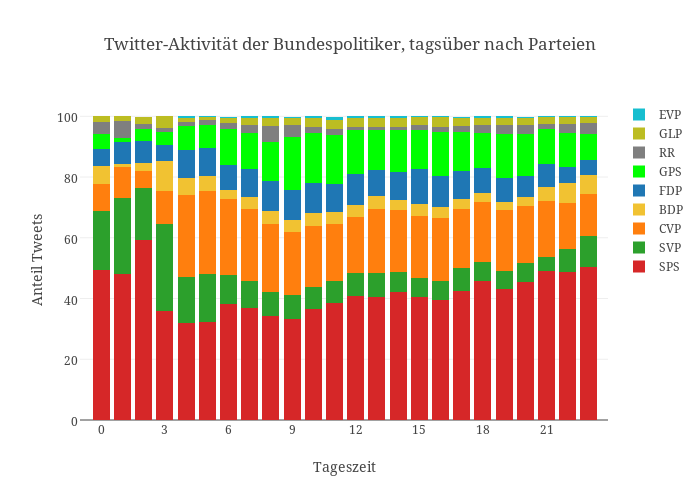
Pmoehr's interactive graph and data of "Twitter-Aktivität der Bundespolitiker, tagsüber nach Parteien" is a stacked bar chart, showing SPS, SVP, CVP, BDP, FDP, GPS, RR, GLP, EVP; with Tageszeit in the x-axis and Anteil Tweets in the y-axis.. The x-axis shows values from -1 to 23.9. The y-axis shows values from 0 to 105.36842105263159.