Edit chart
Loading graph
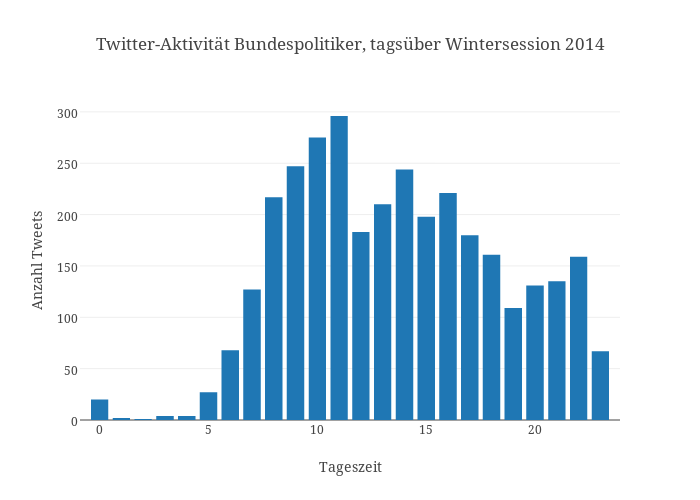
Pmoehr's interactive graph and data of "Twitter-Aktivität Bundespolitiker, tagsüber Wintersession 2014" is a bar chart, showing Col2; with Tageszeit in the x-axis and Anzahl Tweets in the y-axis.. The x-axis shows values from -0.9 to 23.9. The y-axis shows values from 0 to 311.57894736842104.