Aug 2016
Sep 2016
Oct 2016
Nov 2016
Dec 2016
Jan 2017
Feb 2017
Mar 2017
0
100
200
300
400
500
600
Monthly Pass
Flex Pass
Date
Passholder Types
plotly-logomark
Edit chart
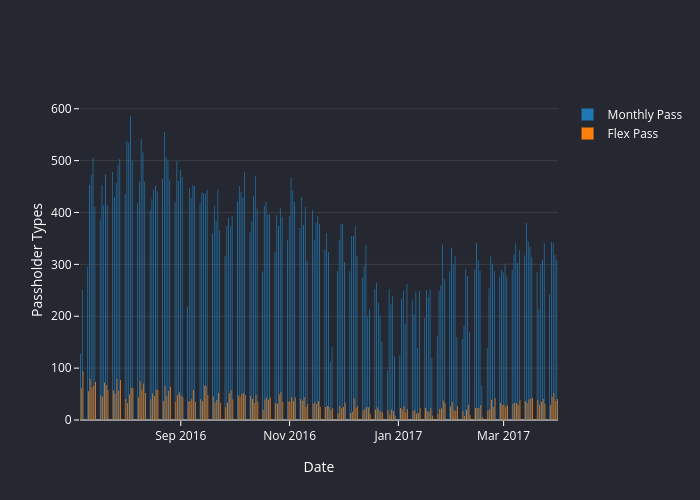
Pnoonan32's interactive graph and data of "Passholder Types vs Date" is a bar chart, showing Monthly Pass vs Flex Pass; with Date in the x-axis and Passholder Types in the y-axis.. The x-axis shows values from 0 to 0. The y-axis shows values from 0 to 0.