Edit chart
Loading graph
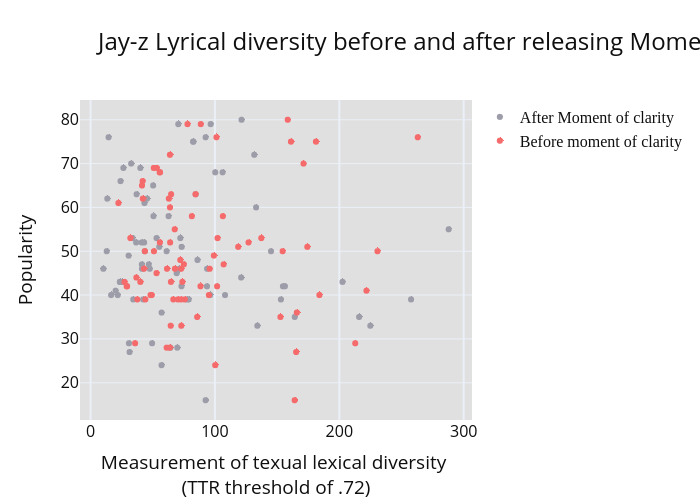
Pocketcheeze's interactive graph and data of "Jay-z Lyrical diversity before and after releasing Moment of Clarity (2003-11-04)" is a scatter chart, showing After Moment of clarity vs Before moment of clarity; with Measurement of texual lexical diversity (TTR threshold of .72) in the x-axis and Popularity in the y-axis.. The x-axis shows values from -6.498963280142194 to 304.6784735201422. The y-axis shows values from 11.687943262411348 to 84.31205673758865.